

Sodankylä Geophysical Observatory |
KAIRA MONITORING : Summary | Operators | BST | SST | XST | Computing | Archive
Beamlet statistics
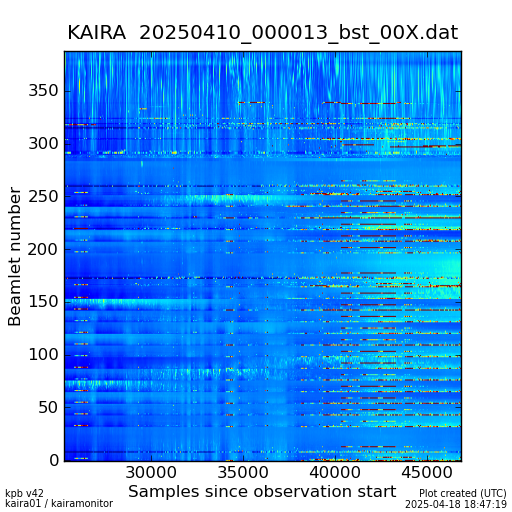
The above plot is a summary of the beamlet statistics from KAIRA. The beamlet number is shown on the left hand side. Depending on the bit-mode being used up to 244, 488 or 976 beamlets are available (for 12-bit, 8-bit and 3-bit modes respectively.
The next plot is a waterfall plot of the beamlet statistics from KAIRA, but for one of the primary monitoring beams. In the default experiment, this beam is tracking either the sun (when it is above the horizon) or a pulsar (when the sun is below the horizon). The midnight sun and polar night seasons mean that the amount of tracking time on each varies greatly during the year.

Because the subbands are not uniformly distributed through the band, there are some differences in the displayed channel sizes. This has been done for visual continuity only and is not used for scientific processing of the data.
The plot is updated every half-hour or so, and it is useful in seeing the RFI conditions and for monitoring the solar (or auroral absorption) conditions. NOTE: For non-default experiments, this plot does not update.
This page automatically refreshes approximately every 5 minutes.
See also:
- KAIRA Data Sheet – technical details and parameters for the KAIRA system.