Sodankylä Geophysical Observatory |
KAIRA MONITORING : Summary | Operators | BST | SST | XST | Computing | Archive

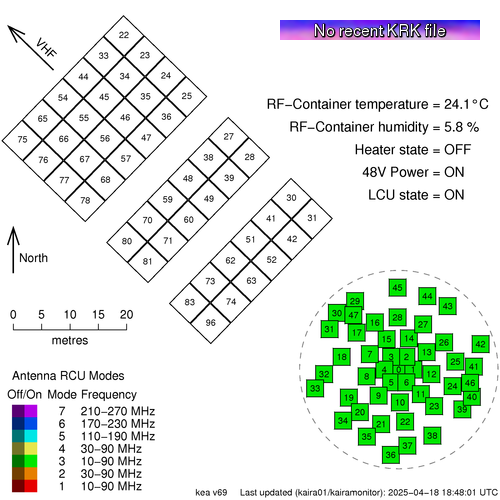
The above diagram is the array status map. The antenna locations are to scale to show the actual layout of the system. Each antenna position is coloured to represent which RCU mode it is using. Additionally, there are data about the current state of the facility more generally; the internal conditions of the RF-container and the state of the container heater and power supply units.
At the top of this page, just under the KAIRA banner, there are links to detailed displays for particular data products. Apart from the operators overview, these take each individual plot, one-by-one, and explain what it means and how to interpret it.
All the pages in the monitoring section of this website automatically-refresh — there is no need to reload your browser window to get updates. The refresh time is generally listed at the bottom of the page.
Real-time monitoring is currently provided as part of the KAIRA archive system. As this system is provided externally, there are some propagation delays as the data are processed and moved through the system. Thus some lag behind real-time can be expected.
Real-time warnings
The monitoring system will report any warnings on the array status map and via the KAIRA status label.
- - - - - - - - - - - - - - - - - - - - - - -
![]()
- - - - - - - - - - - - - - - - - - - - - - -
The most critical error will be shown as a priority (thus, operational/acquisition errors are shown in preference to archiving errors). A full list of all current warnings (if any) is as follows:
The following warning conditions apply

--------------------------------------

   No recent KRK file

--------------------------------------

Last updated:  2025-04-18 18:48:01 UTC
The above list is updated periodically by the real-time monitoring system.
This entire web page automatically refreshes approximately every 5 minutes.
To cite the KAIRA software system, use the UiT Munin archive record (BibTeX).
See also:
- KAIRA Data Sheet – technical details and parameters for the KAIRA system.
- KAIRA data archive – information about the backup storage of critical data products.
- Auroral conditions – monitoring of northern lights over Kilpisjärvi.


