Introduction

The GNU Ionospheric Tomography Receiver (Jitter) is a software package capable of measuring phase curves from dual frequency beacon satellites, such as the Russian Tsykada satellites, DMSP F15, Radcal, or the FORMOSAT fleet. This is done using the gnuradio framework and Ettus Research software defined radio hardware. These phase curves can be used to calculate relative total electron content curves. With a network of multiple receivers, this data can be used as an input to a limited angle tomographic algorithm to produce a tomographic reconstruction of the ionosphere.


An example phase curve measured using Jitter. Download hdf5 data file for this example.

Jitter is different from the GNU Digital Beacon Receiver provided by Prof. Mamoru Yamamoto. The main difference is that Jitter is designed for autonomous operation in a large network of receivers. Jitter is also capable of simultaneously receiving multiple satellites. However, the GNU Digital Beacon Receiver web site contains a lot of useful information on designing a beacon satellite receiver.

The Open Radar Initiative also has a project with the goal of building a digital beacon satellite receiver.

Download

New python version out! The software is provided as a C++ program and a set of python scripts, which are located here: beacon-2.0.tar.gz While this is an update, the receiver only works with gnuradio 3.6 at this time. We are working on migrating to 3.7.

Usage

Edit beacon_conf.py.example and save as beacon_conf.py. Run the receiver with ./beacon.py. The raw recordings and analyzed files will start accumulating in the configured data directory. The configuration file allows you to specify how long you store the raw data.

Overview

The program is divided into two parts that are implemented as separate programs: data recording and phase curve analysis. This is because there are also reasons why we would simply want to record signals from satellites flying over a station and perform some other analysis (such as listen to amateur satellites, or record weather satellite down-link data). While the data recording program is written in C++, the phase curve analysis program is written in Python. This allowed easier development of the phase curve calculation routines with a nice interpreted language suitable for scientific computing.

The data recorder application records narrow band (typically 40 kHz, but this is configurable) baseband signals for satellites that fly over the ground station. The program automatically updates it's satellite ephemeris files over the internet from celestrak.com and calculates a schedule for upcoming passes. Thus, it is possible to follow any satellite with a known two-line elements (TLE) ephemeris. The data recording program can simultaneously record satellites within a fairly large band (typically 1 to 10 MHz), each with a separate center frequency. We have tested simultaneous recording of six satellites (there rarely are more beacon satellites in the sky simultaneously), and even in this case, the program is not using very much CPU resources.

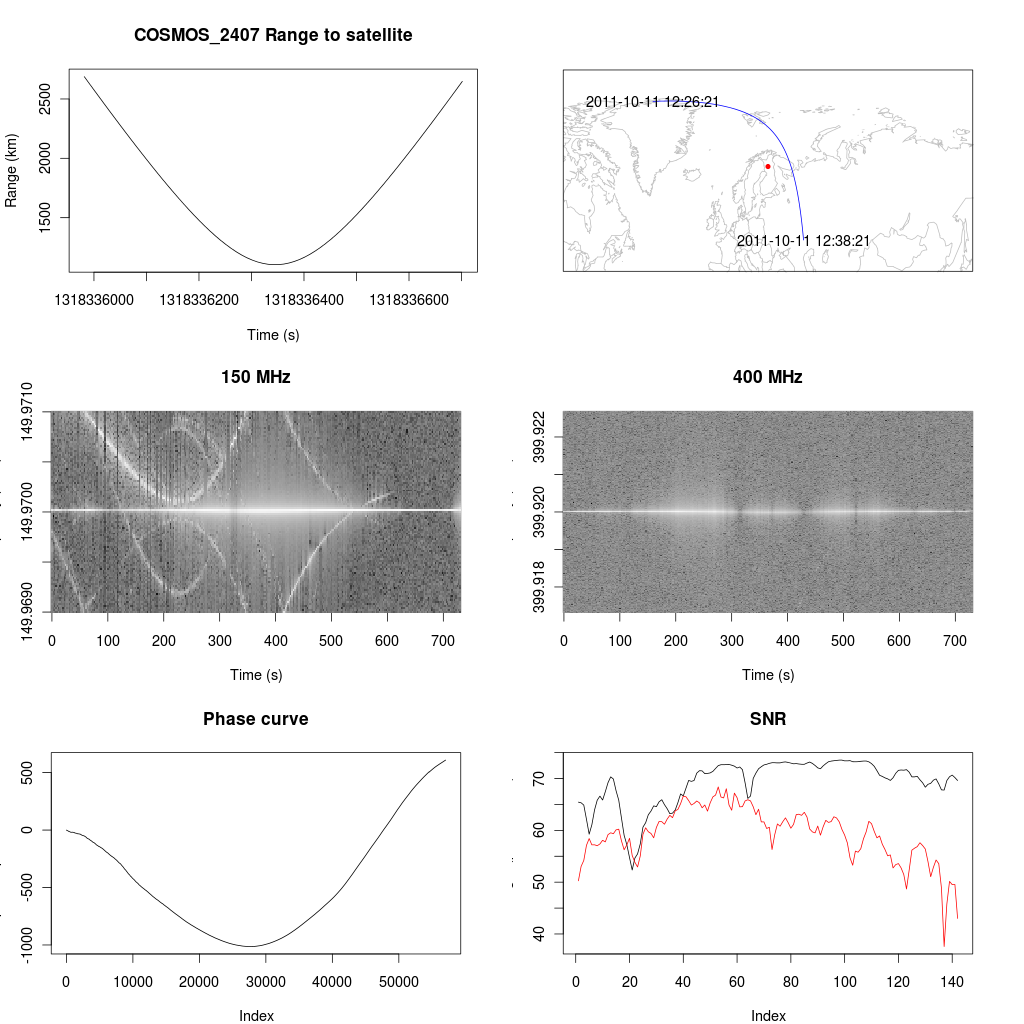
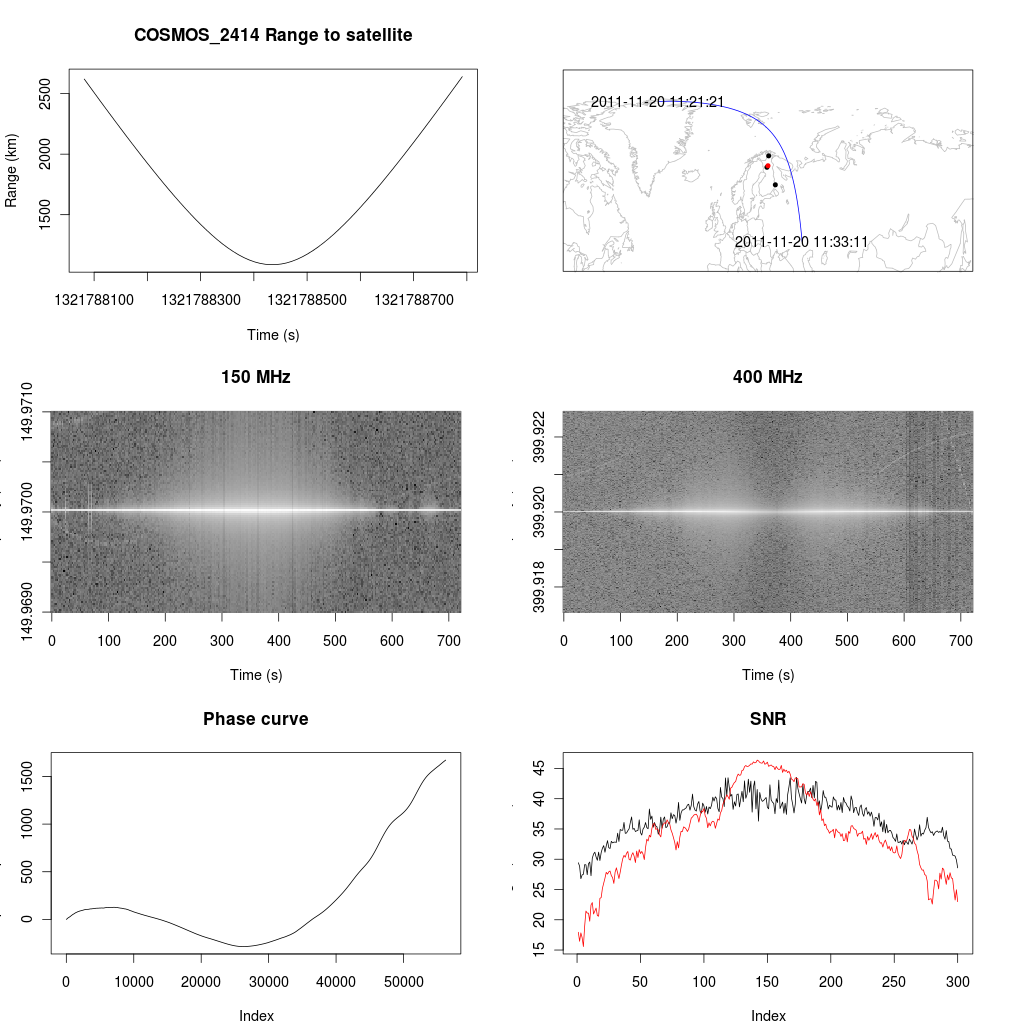
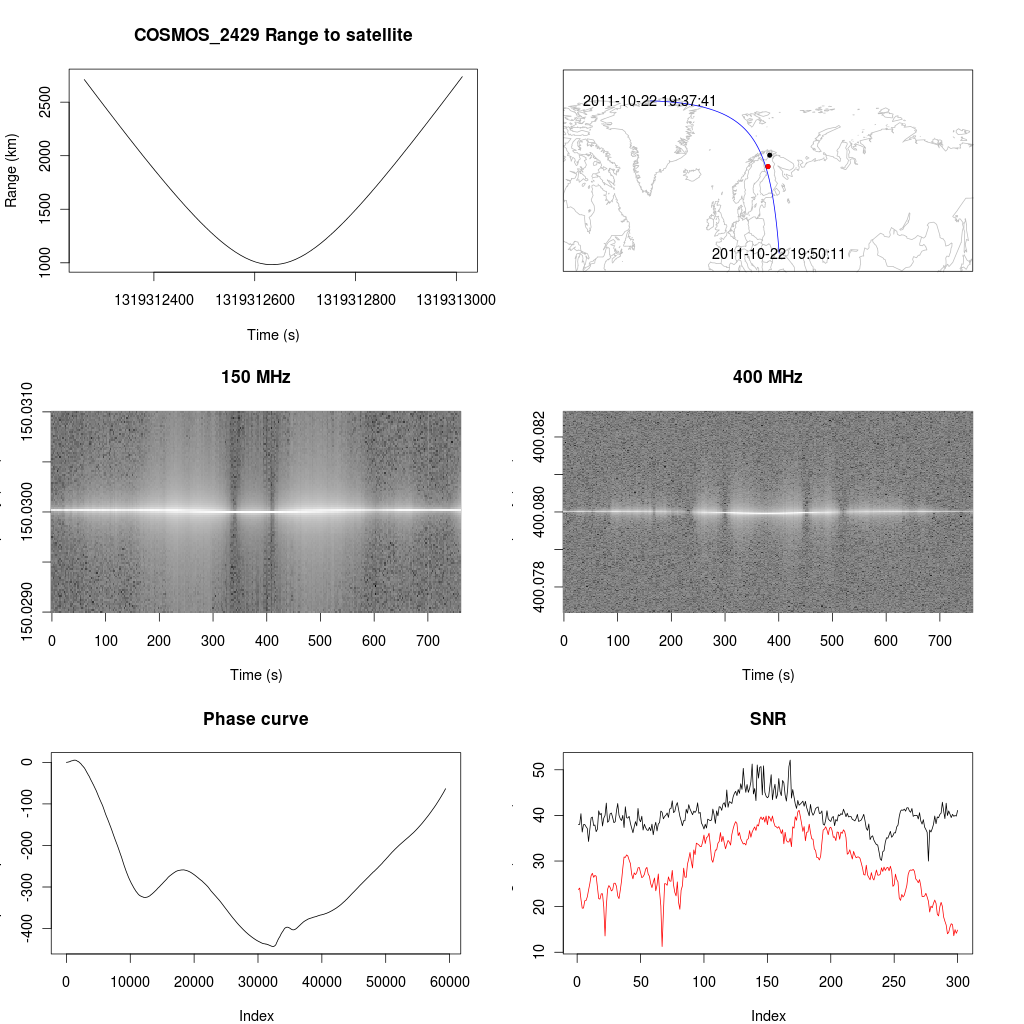
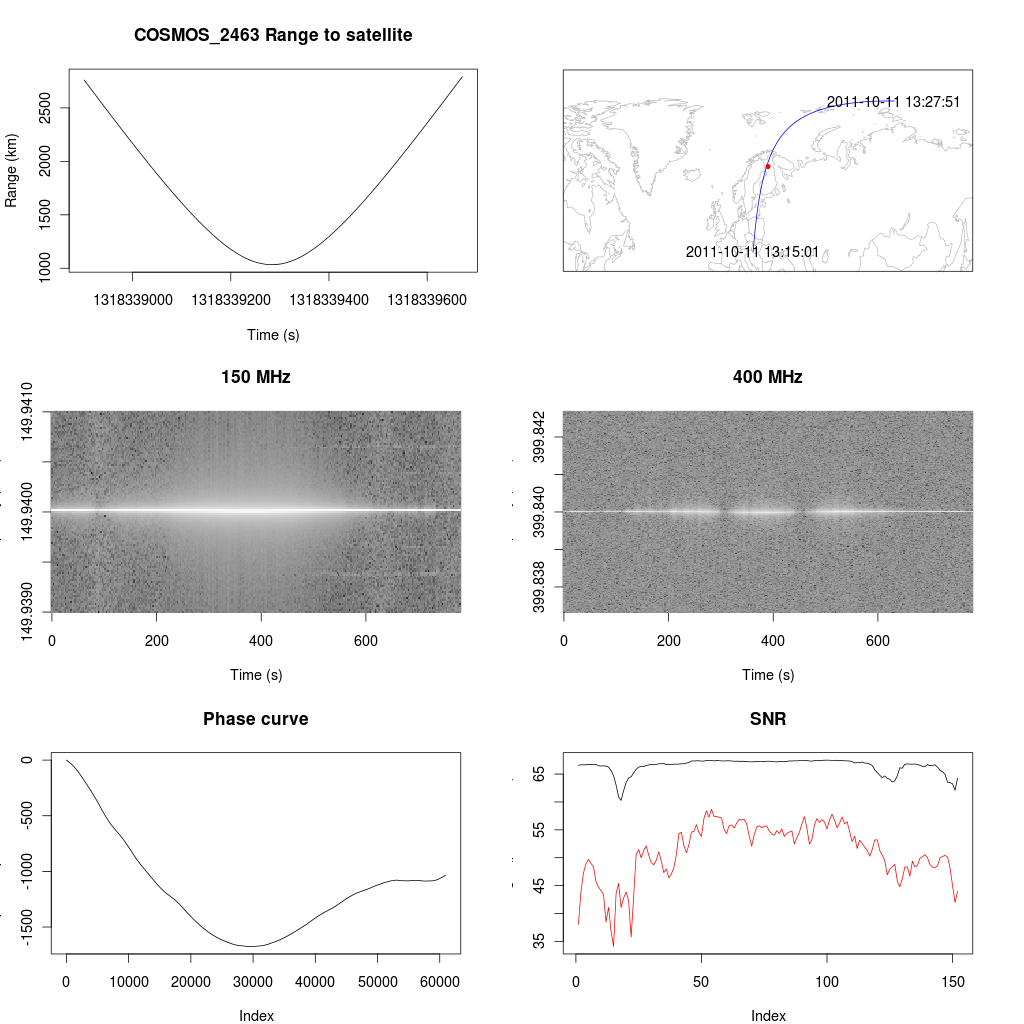
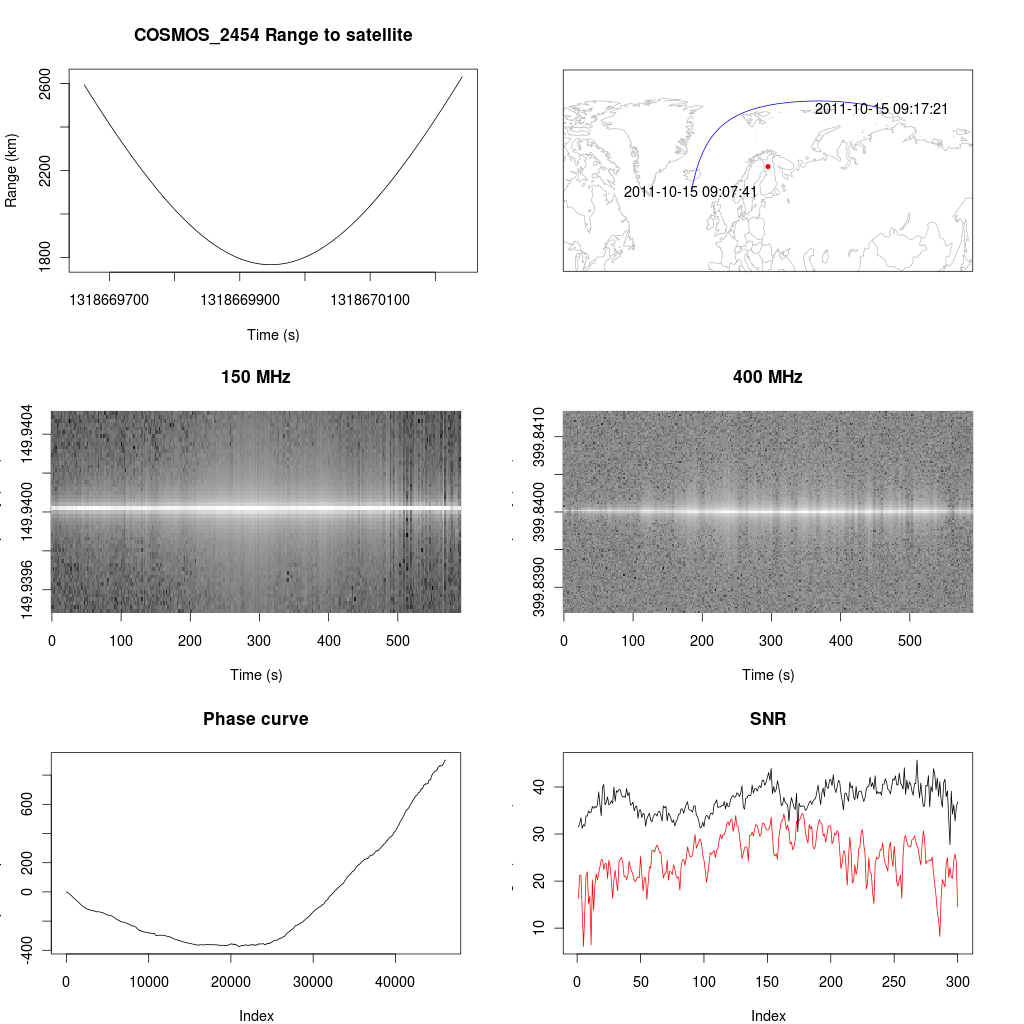
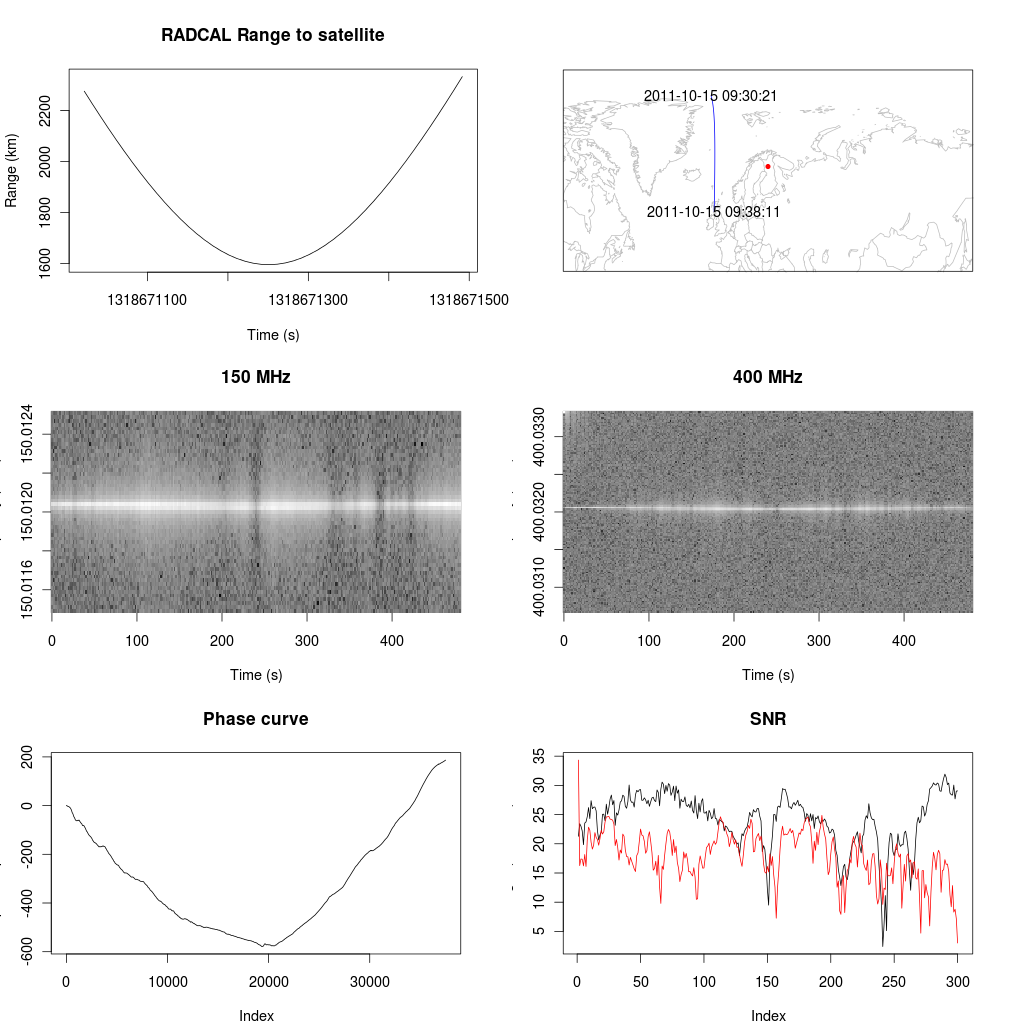
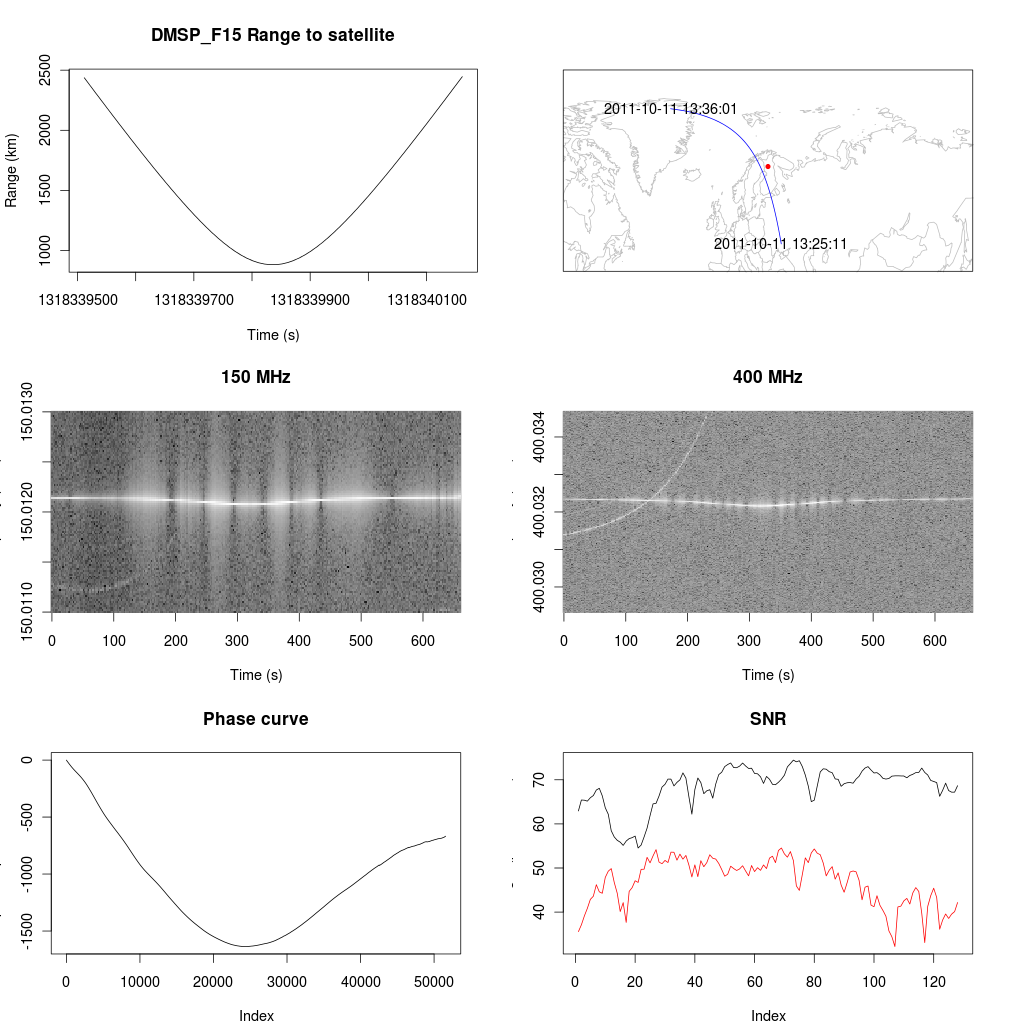
The phase curve calculation program is run as a separate process. It goes through all newly recorded raw data files and calculates the relative phase difference between the two carrier frequencies transmitted by the satellite. The phase curve is by default analyzed at a resolution of 40 Hz, although this is also configurable. The phase curve calculation does not require the receiver to be locked to a global reference, but it requires the satellite ephemeris to be relatively well known (the accuracy provided by celestrak is enough).

The software is designed to be operated from a single directory, requiring no system-wide installation of the binaries. While the software in theory should work with any operating system, only Linux has been tested so far.

Example hardware

A block diagram of an example analog frontend designed by Antero Väänänen is located here.

The preamplifiers are special order HAM parts for Kuhne Electronic, and the other components are from mini-circuits. The dual band QFH antenna is by Nagara Denshi Kogyo Co. Ltd..

The price of a full tomography receiver, including the antenna, cabling, RF frontend, the USRP N210, a TVRX2 daughterboard, a GPSDO, and a computer is approximately 5000 e.

Contact

Jitter has been developed by Juha Vierinen. You can contact me by e-mail: j (AT) sgo.fi.

Examples

Here are example measurements of beacon satellites that can be observed over Northern Finland. The spectrograms are Doppler corrected (resulting in a straight line), and the relative time delay between the two freuquencies are measured in radians.