

Sodankylä Geophysical Observatory |
KAIRA MONITORING : Summary | Operators | BST | SST | XST | Computing | Archive
Cross-correlation statistics
KAIRA routinely records antenna signal covariances (cross-correlation) statistics. These can be transformed to generate all-sky radio images... the equivalent of a "fish-eye lens", but for VHF radio.
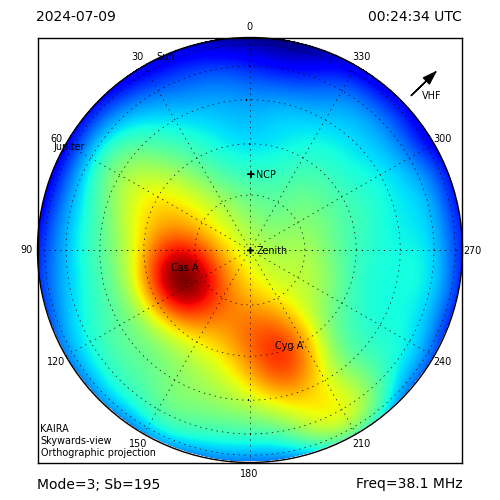
The above plot is a recent all-sky image from KAIRA. It is formed from the antenna-pair cross-correlations, which are then fourier-transformed to obtain the output image. The projection is orthographic and the orientation is indicated on the plot. The "VHF" label indicates the azimuthal direction to the EISCAT VHF transmitter, which is a significant scientific instrument, located nearby. The other labels indicate prominent radio sources.
This page automatically refreshes approximately every 5 minutes.
See also:
- KAIRA Data Sheet – technical details and parameters for the KAIRA system.